 Back in the dark ages of web development (2003) debugging tools were extremely limited. You just had to kind of "think like a browser" to figure out why something wasn't working. Thankfully, those days were banished forever with the introduction of the extremely influential Web Developer Toolbar by Chris Pederick.
A while ago I realised I was relying heavily on the "think like a browser" technique for debugging mobile web applications - so I put together a mini console/info/code executor thing to help mobile phones spill their guts. It's called "WadBug: the web app debugger". And here it is in action: Wadbug Test Page.
You can add the WadBug to any of your existing projects by including the wadbug.js and wadbug.css files (It also relies on jQuery - sorry 'bout that). Refresh your app, and a badly designed X will appear in the top left corner. Click it, and WadBug springs to life.
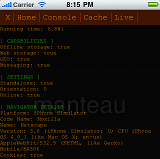
What do you get? Well, the Home menu will give you some info on the capabilities of the device: what's supported, screen widths etc. And the Cache menu will show you any offline cache events that fire - unbelievably useful if you are trying to make offline web apps!
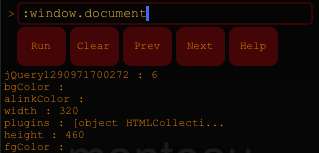
But the guts is really the Console menu which is a rudimentary console that will show logs and let you execute code. It also has a feature for inspecting JavaScript objects - if you prefix an object name with a colon, it will iterate over the object, rather than just spitting out "[object object]"... for example, in the test page try ":wadbug" to inspect the wadbug global object.
The final feature is the most coolest and weirest. Clicking on the Live menu will start polling (via Ajax) for changes in the wadbug_code.js file. When it changes, the code is eval-ed into the web app - so you can modify code without having to do a web page refresh. I've found this damn useful for testing CSS3 transitions and animations.
The poller calls a PHP file which calculates a dodgy hash, reads any contents (up to an End-Of-File marker) and returns the code. You'll have to port this code if you want to use it in other languages.
I had big dreams of turning WadBug into a highly polished product that becomes the must-have tool for web app developers. But as it has sat un-modified for so long, I'll just be content with plopping it out into the world.
WadBug on GitHub.
One Comment
Depending on what mobile platforms you’re working with you can also use Opera Dragonfly to do remote debugging: http://dev.opera.com/articles/view/remote-debugging-with-opera-dragonfly/
I saw it running on a touch screen panel at web directions east, allowing you to inspect the DOM and JavaScript debug. Pretty cool (provided your platform supports Opera Mobile :P)