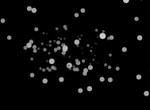
 Ah ha! First time on this blog where I've started a "series" and got past post 1. (Check out post one: called "Part 0"). Well anyway, it turns out that my theory that simple 3D is easier that it seems was correct. Based on my vague inclination of how the maths should work, I constructed a lil' 3D starfield and, more importantly, I pretty much completely understand how it works. Pretty much completely. Accordingly, this post will cover setting up our "field of view" and projecting our 3D stars on to our 2D screen with parallel projection.
Modelling 3D in data
This tutorial won't be talking about polygons or even lines: we're sticking with plain-old points until we figure it all out. To model a 3D point we just need to keep track of it's X position, it's Y position, and it's Z position. To get the results we are after we'll think of the X/Y axis like we know from maths: a cross in the center of the screen, with positive Y going up, negative Y going down, positive X going right and negative X going left. This is different from how the screen works - where the point X=0, Y=0 is in the top left hand corner, not in the center. So we'll need to do a little bit of a conversion at the end to translate from "maths axis" to "screen coordinates" - but that's easy.
So to make our starfield, what we'll do is create a bunch of points and set their X value to a random number between the left side of the screen and the right. We'll set the Y value to a random number between the top of the screen and the bottom. Finally, we'll set the Z value to a random number between 0 and some number that represents the horizon. That's easy to model, but how do we draw the stars on the screen so it looks like points in the distance move closer to the horizon - like you see in perspective drawings?
Perspective is easy!
Roool easy: we just divide the X and Y values by the Z value. Think about that - it makes sense! Pretend that X = -100 (so it's on the left side of the screen). And pretend that the Z value is 1 (right up the front of the screen). Now, -100 / 1 = -100. So we just draw the point at -100 pixels. NOW, imagine the point moves further into the distance, so Z = 2. With the new distance, -100 / 2 = -50. So the point is drawn much closer to the center of the screen. if Z = 3, then -100 / 3 = -33.3. The larger that Z becomes, the closer the point moves towards the middle of the screen: thus simulating perspective! That's all there is to it!
Seriously, that's it. You could take this knowledge and create a starfield now easily:
- Randomly assign X, Y, Z
- Move Z a bit closer (if it's too close, send it to the back)
- Draw all the points at X/Z, Y/Z
- GOTO 2
In the code, we do random assigning in the init function, and we move Z closer in the update section:
star.z -= this.starSpeed;
if( star.z <= 0 )
	star.z = this.maxDistance;
Finally, we figure out the place to draw the stars with this snippet:
// Project to 2D space
star.projectedX =
	( star.x * this.hViewDistance ) / star.z;
star.projectedY =
	( star.y * this.vViewDistance ) / star.z;
We are doing the projection calculations inside the update function, instead of the drawing function - and store the projected X and Y values in the star object itself: we don't need to do this, we could just calculate it in the drawing function, but I thought it might make it a bit clearer. It probably didn't.
If you look at the code, you'll notice there is also a Size and Colour variable being stored with each point. This is to create the effect that closer stars are bigger, and brighter than stars in the distance. It's basically just an inverse function of the Z index (so a small Z equals a big star!)
Anywayz, the only remaining piece of the puzzle is... what are the variables hViewDistance and vViewDistance? They are just some numbers that affect the overall result of how the points as a group are skewed. You could just test a bunch of numbers in there to see what looks good, buuut, this series is about understanding why it works... So, I give you - "the field of view"...
Field Of Views: The hardest bit
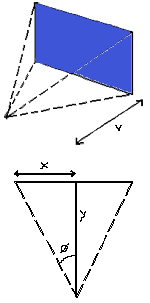
Now don't let those brilliantly illustrated graphs on the left put you off. We just need them to show why we're using a couple of magic numbers in our equations. The top graph is supposed to illustrate the concept of a "Field Of View", like when you look at stuff, you know? Check out this article on FOV: it says (kind of) that humans see 100 degrees on the X axis, and 80 degrees on the Y axis (but also says [citation needed] at the end, but good enough). Really we don't need to know anything about FOV, we just want a good number for Y and theta that sort of looks like the real world. Y (or V on the top graph) is our "viewing distance" and theta is our FOV.
We'll figure out all the bits with using the SOHCAHTOA thing I remember learning. We know the theta, and we know the "OPPOSITE" side - which is half of the screen width (or height for the vertical one). And we now just want the "ADJACENT" side to figure out the viewing distance. As TAN = OPPOSITE / ADJACENT, then also ADJACENT = OPPOSITE / TAN.
So... theta is FOV / 2... but we gotta convert it to radians, cause that's what computers like. So we end up with something like:
// Convert degrees to radians
var hfov = 100 * Math.PI / 180;
var vfov = 80 * Math.PI / 180;

// Figure out the horizontal and vertical distances
var hViewDistance =
  ( screenWidth / 2 ) / Math.tan( hfov / 2 );
var vViewDistance =
  ( screenHeight / 2 ) / Math.tan( vfov / 2 );
Our first mathtastic challenge complete! We have the magic viewing distance numbers. Now we can change the horizontal and vertical fields of view to see how it changes the overall effect.
Translating to screen coordinates
The last thing we need to do is translate from traditional X/Y axis to normal screen coordinates. We just need to perform these simple calculations:
// Transform to screen cordinates
star.projectedX += this.screenWidth / 2;
star.projectedY = ( this.screenHeight / 2 ) - star.projectedY;
Test that out on paper if you don't believe me.
The new dimension
So that was that. Just divide X by Z and Y by Z and we are cooking! Grab the code and have a play with the Fields of View, the number of stars, etc... try incrementing and decrementing X and Y in the update function too and see what happens.
Next time we'll have a look at moving from points to lines and see if we can't get some cube madness going!
4 Comments
Nice! But it looks like some of the stars in the background get drawn over top of stars in the foreground?
Very true Non, very true – the reason is, we are not taking the z order into account when we draw – we’re just drawing randomly. Probably should have assigned the Z value incrementally, rather than randomly… but also, we’ll look at z order soon when we get to draw polygons.
Awesome tutorial. Guess you never got t part two?
I love this post. It explains the basics very well, and thats just what I need when I have just started looking into graphics :)